The authors of PhysResponse, an arXiv benchmark for video generators, report that across ten image-to-video models the best parameter errors are still more than ten times those of physically correct videos (arXiv). They also say models rarely reproduce both outcomes of a transition pair, and that common visual metrics such as PSNR miss failures the benchmark exposes. For anyone choosing a model for physically plausible motion, the result suggests that pixel-similarity scores are a poor guide.
What the benchmark measures
PhysResponse tests physical parameter responsiveness at two levels, according to the paper. The first level inverts a simulator conditioned on the scene, recovering the gravity, friction and starting speed that the generated motion effectively shows. The second level evaluates events near critical transitions. The idea is to intervene on a physical setting and check whether the generated video responds to it, instead of judging whether a clip merely looks plausible.
The authors evaluated ten models on Core100 using four prompt formats and seed 0, which produced 4,000 generated videos (arXiv). To calibrate the measurement, they ran ground-truth videos through the same pipeline, which showed errors of 3.6% for gravity, 1.4% for friction and 1.1% for speed. Those ground-truth figures are the floor against which the models’ errors are compared, and they are what the order-of-magnitude gap in the lead refers to.
Visual metrics reward standing still
| Model | Visual and motion consistency: L2 err. ↓ | Visual and motion consistency: S-IoU ↑ | Visual and motion consistency: PSNR ↑ | Visual and motion consistency: SSIM ↑ | Source page |
|---|---|---|---|---|---|
| Condition frame repeated | 12.59% | 0.000 | 37.8 | 0.977 | https://arxiv.org/html/2611.24419 |
| CogVideoX-1.5 | 13.59% | 0.057 | 22.9 | 0.844 | https://arxiv.org/html/2611.24419 |
| Cosmos-Predict2 | 13.60% | 0.071 | 20.8 | 0.800 | https://arxiv.org/html/2611.24419 |
| Cosmos3-Nano | 17.40% | 0.153 | 29.7 | 0.935 | https://arxiv.org/html/2611.24419 |
| HunyuanVideo-1.5 | 14.90% | 0.200 | 27.4 | 0.927 | https://arxiv.org/html/2611.24419 |
| MiniMax-H3 | 13.93% | 0.290 | 27.7 | 0.853 | https://arxiv.org/html/2611.24419 |
| PhysAlign | 19.29% | 0.217 | 30.1 | 0.940 | https://arxiv.org/html/2611.24419 |
| PhysRVG | 12.94% | 0.049 | 30.3 | 0.926 | https://arxiv.org/html/2611.24419 |
| VideoGPA | 16.10% | 0.064 | 22.0 | 0.806 | https://arxiv.org/html/2611.24419 |
| Wan2.2-I2V-A14B | 17.16% | 0.099 | 21.0 | 0.702 | https://arxiv.org/html/2611.24419 |
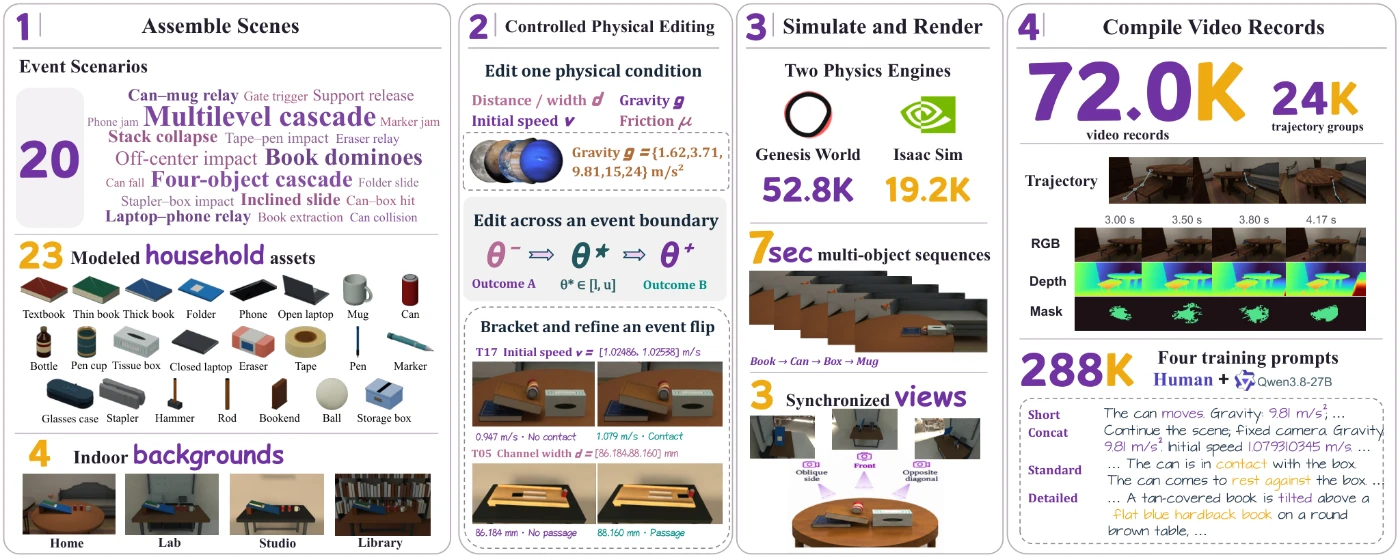
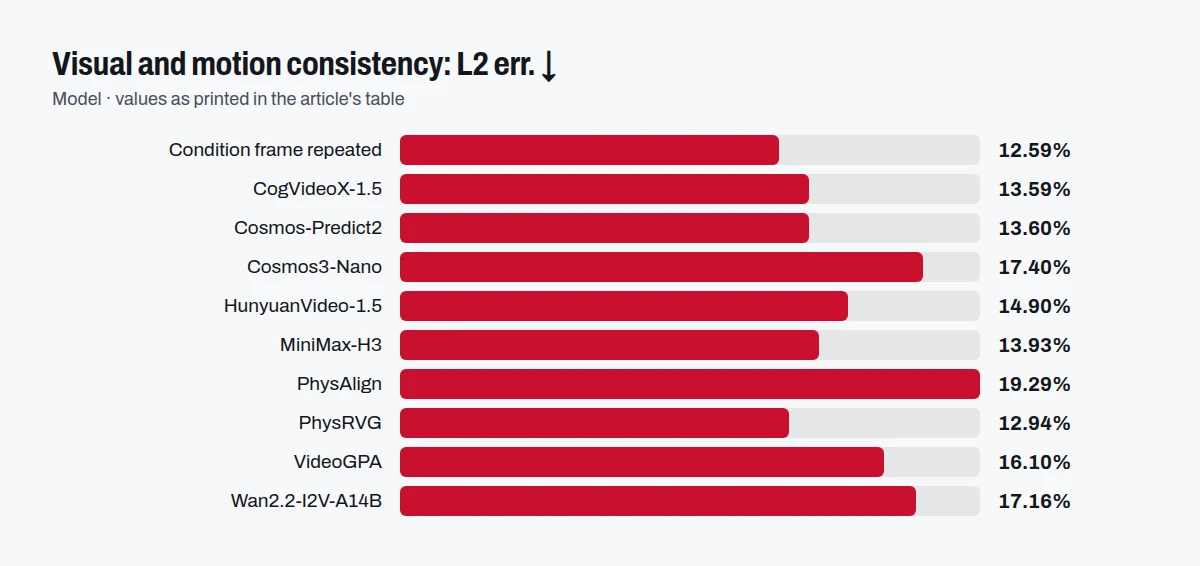
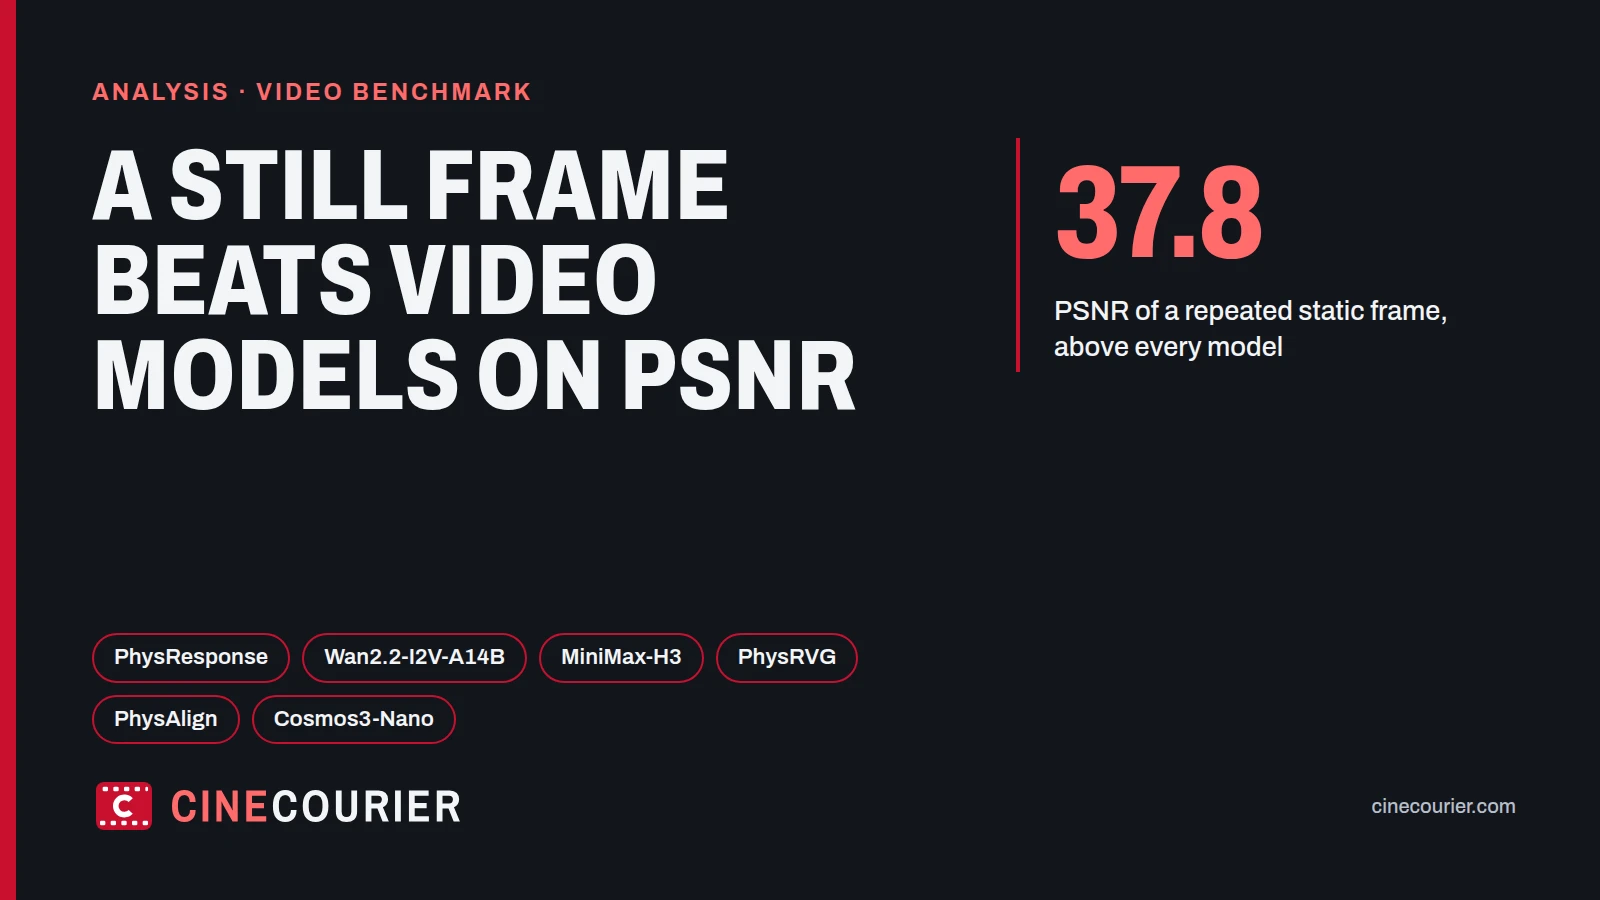
Table 2 (a) of the paper pools all four prompt formats and reports visual and motion consistency for each model, with a row that simply repeats the condition frame. That repeated frame has an L2 error of 12.59%, an S-IoU of 0.000, a PSNR of 37.8 and an SSIM of 0.977. The authors state that repeating the condition frame beats every model in PSNR, SSIM and L2 error. The table shows why: the repeated frame has an S-IoU of 0.000, so it contains no motion, yet its PSNR of 37.8 is above every model’s, with PhysAlign at 30.1 and PhysRVG at 30.3 the highest among the models. A static clip scores best on similarity while failing the actual task, so these metrics reward weak motion.
Among the models, PhysRVG has the lowest L2 error at 12.94%, while PhysAlign has the highest at 19.29%. PhysAlign nonetheless has a PSNR of 30.1 and an SSIM of 0.940, which sits alongside its worst L2 figure. The metrics in this table do not rank models consistently, which is a further reason to doubt any single one of them. MiniMax-H3 shows the highest S-IoU of the models at 0.290, while Cosmos3-Nano reaches 0.153 with an L2 error of 17.40%.
Parameter accuracy and event outcomes diverge
The two levels of the benchmark do not tell the same story. Of 2,385 gravity records scored at both levels, 48 combine small parameter errors with wrong event results, and 929 pair large parameter errors with right results. A model can therefore land on the right event for the wrong physical reason, and a benchmark that checks only outcomes would not see it. This fits the authors’ summary that the two levels expose complementary failures.
Rankings also depend on the measure. The paper says Wan2.2-I2V-A14B ranks first on PairAcc (30.7% and 42.1%) and on VPSR (22.9% and 34.6%). Yet in Table 2 (a) the same Wan2.2-I2V-A14B row has an L2 error of 17.16% and an SSIM of 0.702, the lowest SSIM in the shown rows. A model that leads on event-pair accuracy can look weak on pixel similarity, which supports the case for physics-specific measures.
Scope and limits
The table is the authors’ own and not an independent test, so the figures reflect their pipeline and prompts. The paper limits its real-video transfer test to WorldBench, and its held-out types add no new objects or parameter ranges. Practitioners should read the results as a diagnostic on controlled scenes: they show where current image-to-video models fall short on gravity, friction and speed, not how they behave across arbitrary footage.
What the sources we read do not state
We check six facts on every story in the full text of each source. The pages listed under Sources do not state hardware requirements.
How we built this
Published resultsTable 2 (a) of the paper: No model follows the prompted physics
Rows of Table 2 (a) of the paper (arXiv HTML version), copied cell for cell by our code; a two-row header is shown as "group: column"; an empty name cell repeats the name above it. These are the authors' own figures, not an independent test. The table has 11 columns; 5 shown. Not shown: Kinematics (2 columns), Effective parameter error (3 columns), Human. Rows: the first 10 of 11.
Sources
The sources this article was written from. Links open the original page.